The financial landscape of the Championship is set to be fascinating, with a huge difference that got fans saying same thing

Championship Clubs Ranked by Their Annual Wage Bill: West Ham Lead the Way
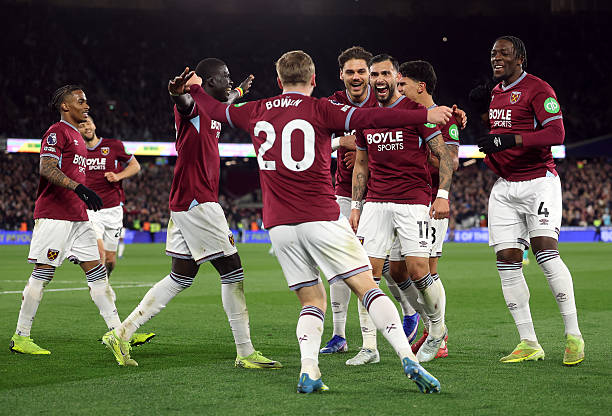
The financial landscape of the Championship is set to be fascinating, with a huge difference in annual wage commitments between the clubs at the top and those operating with much smaller budgets. Based on the figures provided, West Ham United have the highest estimated annual wage bill on the list at £56.52 million, followed by Wolverhampton Wanderers at £48.62 million.
The figures highlight just how differently clubs can approach squad building, with some teams capable of committing tens of millions of pounds to player wages while others operate on budgets below £10 million.
At the top of the list, West Ham’s estimated £56.52 million wage bill puts them comfortably ahead of Wolves, who are reported at £48.62 million. Burnley are next with £33.14 million, while Southampton are estimated at £26.36 million. These numbers demonstrate the significant financial strength available to some of the clubs competing at this level.
Middlesbrough are also among the higher spenders, with an estimated annual wage bill of £24.54 million. They are followed by West Bromwich Albion, who are listed at £23.14 million, and Sheffield United, whose estimated wage bill stands at £22.91 million.
Further down the list, Cardiff City are reported at £20.80 million, while Norwich City have an estimated wage bill of £19.55 million. Birmingham City are next at £18.25 million, showing that there remains a sizeable gap between the biggest spenders and the clubs in the middle of the table.
The numbers become considerably smaller from this point. Stoke City have an estimated annual wage bill of approximately £14.20 million, while Watford are around £13.50 million. Swansea City follow at approximately £11.80 million, with Bristol City estimated at around £10.50 million.
The financial gap becomes even more noticeable among the lower-spending clubs. Queens Park Rangers (QPR) are estimated at approximately £9.10 million, followed by Preston North End at around £8.40 million. Millwall are listed at approximately £8.10 million, while Blackburn Rovers have an estimated wage bill of around £7.90 million.
Portsmouth are next with approximately £7.20 million, while Bolton Wanderers are listed at £6.30 million. Lincoln City have an estimated annual wage bill of £5.80 million, with Wrexham AFC at approximately £5.50 million.
At the bottom end of the list, Derby County are estimated at around £5.20 million, while Charlton Athletic have the smallest figure provided, at approximately £4.80 million.
The figures provide an interesting picture of the financial demands involved in building a competitive Championship squad. A large wage bill does not automatically guarantee success, but it can give clubs greater ability to attract and retain experienced players. At the same time, clubs with smaller budgets may need to rely more heavily on smart recruitment, academy development, loans and careful contract management.
The enormous difference between West Ham’s £56.52 million and Charlton’s £4.80 million also demonstrates the financial disparity across the clubs included in the list. That is a difference of more than £50 million in estimated annual wages.
Ultimately, the wage bill is only one part of the equation. Recruitment quality, coaching, squad balance, injuries, consistency and team performance all play major roles. Nevertheless, these figures offer a useful snapshot of the financial muscle behind the squads and show which clubs are committing the most money to their players.
Full Annual Wage-Bill List
| Rank | Club | Estimated Annual Wage Bill |
|---|---|---|
| 1 | West Ham United | £56.52 million |
| 2 | Wolverhampton Wanderers | £48.62 million |
| 3 | Burnley | £33.14 million |
| 4 | Southampton | £26.36 million |
| 5 | Middlesbrough | £24.54 million |
| 6 | West Bromwich Albion | £23.14 million |
| 7 | Sheffield United | £22.91 million |
| 8 | Cardiff City | £20.80 million |
| 9 | Norwich City | £19.55 million |
| 10 | Birmingham City | £18.25 million |
| 11 | Stoke City | ~£14.20 million |
| 12 | Watford | ~£13.50 million |
| 13 | Swansea City | ~£11.80 million |
| 14 | Bristol City | ~£10.50 million |
| 15 | Queens Park Rangers | ~£9.10 million |
| 16 | Preston North End | ~£8.40 million |
| 17 | Millwall | ~£8.10 million |
| 18 | Blackburn Rovers | ~£7.90 million |
| 19 | Portsmouth | ~£7.20 million |
| 20 | Bolton Wanderers | £6.30 million |
| 21 | Lincoln City | £5.80 million |
| 22 | Wrexham AFC | ~£5.50 million |
| 23 | Derby County | ~£5.20 million |
| 24 | Charlton Athletic | ~£4.80 million |